Plasma coating describes an industrial production process in which components of all kinds are coated with thin layers of different materials. In order to receive high quality results it is of interest to obtain a homogenous layer based on a consistent composition. The information on the compounds of a plasma arc can potentially be retrieved using hyperspectral imaging.
However, plasma coating is a high speed process which demands not less than a near real-time analysis, making it impossible for push-broom sensors to be used here. Hyperspectral snapshot cameras by contrast can contribute for such an optimization.
In a pre-study conducted by Cubert it was the goal to detect a spatial pattern in the plasma, which is characterized by different chemical compounds during vaporizing, these compounds shall be visualized with the help of a hyperspectral snapshot camera.
Based on this information, the plasma coating process could be optimized, allowing automated reactions such as electronic readjustment of the whole process.
Setup
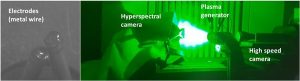
A hyperspectral FireflEYE S185 SE was placed with a fire-resistant blanket in measurement chamber, targeting the electrodes that were used for the plasma coating in a diagonal angle. The optics have been adjusted with a ND-filter and a pinhole aperture in order to protect the optics of the hyperspectral camera.
The electrodes (diameter 1-1.5mm) are coated steel wires consisting several chemical substances, mainly various steel alloys. They are powered with strong electrical pulses, generating the plasma.
Collapse of the plasma arc
In a first test run the hyperspectral snapshot camera was used to record the collapse of the plasma arc. For this, the integration time of the camera was set to 200ms, allowing to collect the transition from plasma, which is extremely bright, to the comparatively darker thermal annealing of the metal wires. The figure below visualizes this process.
Four exemplary pseudo RGB images (650‑500‑450nm), taken at time stamps 0ms, 333ms, 667ms and 996ms, show how from the first to the last image the plasma arc collapses. Below the RGB images selected spectra (raw data) are shown, they represent the spectral information of marked pixels (rectangles inside the RGBs). Especially the first image showing active plasma is overexposed as expected, but also those areas of the other images that show the sweltering wires are overexposed as well.
In the second image the last plasma is driven out, thereupon the electrodes have cooled down (images three and four). It is remarkable that on the same time a considerable proportion of the metal wire is vaporized, even after the electrodes already have been deactivated.
Detecting different compounds in the plasma coating process
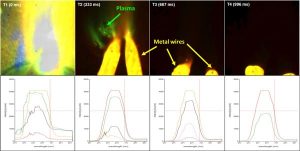
For the actual purpose of identifying different compounds within the plasma coating process, the hyperspectral camera was used to record a video with an integration time of 20 µs. In the following four exemplary measurements, all taken within one second (T1@415ms, T2@500ms, T3@725ms, T4@864ms) are analyzed.
The following figure again shows pseudo RGB images (650‑500‑450nm) of this measurement series. Besides the very bright plasma beam both vaporized (bright) and liquid metal (dark) are visible. The spectra below the images show the spectral information of the green and red rectangles inside the RGBs.

Analysis
The analysis shows that during the welding process the intensity of the spectra vary, as it is expected. Among all measurements, designated maximum peaks could have been identified, which vary in their intensity in relation to each other, but are stable on their wavelength position. This implies the individual spectral signatures of different chemical compounds that are vaporized within the plasma. In order to visualize that behavior a common normalized difference index is used, which considers two selected bands with I = (b1–b2) / (b1+b2).
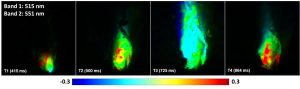
The following figure shows the relation of the wavelengths 515nm and 551nm. The values of the pixels inside the images range from -0.33 up to 0.3. A spatial pattern within the plasma clearly becomes visible.
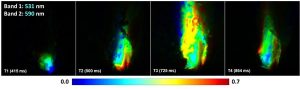
When applying further wavelength peaks to the normalized index (in the following example 531nm and 590nm) as it can be seen in the following figure, the pattern shows a different behavior than in the previous figure.
Conclusion
This indicates that, by using a hyperspectral snapshot camera, it is possible to recognize and identify, at a later stage, different chemical compounds within the plasma during the welding process.
