The FireflEYE V185 was, at the time of its launch in 2012, the first hyperspectral camera that could acquire a complete hyperspectral data cube (x, y, λ) with one single image shot. The prism-based sensor technology offered light efficiency of up to 70 %. With 125 spectral channels (450 nm to 950 nm) and an image size of 50×50 px, 2500 spectra were recorded simultaneously. However, with just 50×50 px, it is difficult to resolve spatial structures in the image. Therefore, a second image sensor with only one band (panchromatic) was integrated into the camera, imaging the same view with an additional 1000×1000 px. With this information, users can perform a pansharpening of the spectral data which transforms the final data cubes to a maximum size of 1000 x 1000 x 125.
Today, the new Cubert ULTRIS cameras break new ground as the first HSI cameras that are based on light field technology. The ULTRIS X20 features an Ultra-HD CMOS sensor with 20 MP, which made it the imaging spectrometer with the world-wide highest resolution when it was released in 2021. During image acquisition, the object is recorded with a multitude of images, each with its own optical bandpass filter with a different center wavelength.
Depending on the ULTRIS camera model, this is made possible by combining a lenslet array with a mosaic bandpass filter (ULTRIS X20) or with a continuously variable bandpass filter (ULTRIS S5). The ULTRIS X20 provides a native image resolution of 410 × 410 px with 164 spectral channels, continuously covering the wavelength range from 350 nm to 1000 nm, which produces the previously unheard of number of 168,000 spectra/image, acquired simultaneously. The ULTRIS S5 provides a native image resolution of 290 x 275 px with 51 channels covering the range between 450 nm and 850 nm. The 12-bit sensor of the cameras makes it possible to detect minute intensity differences in the spectral content while keeping the noise level very low. The GigE camera interface guarantees an image frame rate (model-depending) up to 8 Hz and 15 Hz, respectively.
Three cameras (FireflEYE V185, ULTRIS X20, ULTRIS S5) were installed in the same set-up for image comparison. The exposure time was optimized with the help of a white reference to derive the maximum dynamics. For illumination, a stabilized tungsten light source (100 W) was used with exposure times of 12 ms (FireflEYE V185), 3 ms (ULTRIS X20), and 47 ms (ULTRIS S5). The reflectance properties of the test samples were calculated by subtracting the dark current image from the measurement image and subsequently dividing it by the image of a calibrated 95 % white reference (Zenith Lite). The dark current measurement and the white reference were averaged 20 times to achieve good noise reduction.
The measurements, however, were acquired without averaging or post-processing to allow a direct comparison of the data. The images are presented in their original form without sharpening or smoothing the spectral information to show the true spectral quality of each sensor.
The image comparison chart above shows quantities derived from the hyperspectral data cubes. The first and the second rows show typical RGB (True color) and CIR (Color infrared). The bottom row shows a typical index that is used for vegetation analysis. Each pixel of the different images represents one spectral curve of the respective sensors.
In the case of the FireflEYE V185, the low spatial resolution is obvious. The color representation, on the other hand, is very clear, which is also confirmed by the noise-free images of the vegetation index. ULTRIS S5 has lower spatial resolution and fewer channels, however, it convinces with similar spectral quality, small size, and weight. In addition, the camera is specifically designed for industrial applications. The ULTRIS X20 combines high spatial resolution with low-value variation within a color (low standard deviation). Both the image quality and the spectral quality are excellent. The image noise is on a comparable level with the FireflEYE V185.
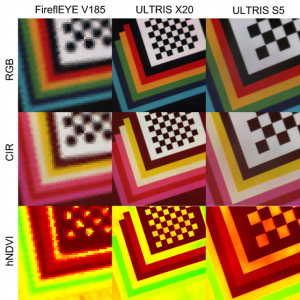
Image comparison of the three hyperspectral cameras FireflEYE V185, ULTRIS X20 and ULTRIS S5. For each camera an RGB image (True color), a CIR image (Color infrared) and vegetation indices (hNDVI) are shown.
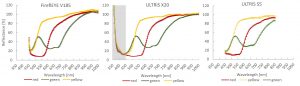
Comparison of the spectral quality of the three Hyperspectral Imaging cameras (FIreflEYE V185, ULTRIS S5, ULTRIS X20). For each camera, the spectra of the red, green, and yellow samples are shown, along with the respective noise indicating standard deviation.
In general, it is possible to measure in the ultraviolet range (UV) with the ULTRIS X20. which can provide further relevant information for specific applications. For the comparison, however, only a halogen light source was used and therefore the UV range is grayed out in the ULTRIS X20 plot.
The graphs show the spectral signature of three differently colored paper samples for each camera. The spectra of all pixels in a pre-defined area with homogenous color were averaged. Because the standard deviation represents the noise equivalent of the sensors, it is used as error bars for each channel. The result shows clearly that the ULTRIS X20 can easily match with the spectral quality of the FireflEYE V185 even though the ULTRIS has a tremendously higher spatial resolution.
